
Most fitness industry “data” comes from surveys, app downloads, or anonymous panels of a few thousand users. The numbers in this report come from somewhere more honest: the door itself.
Between January 1 and March 31, 2026, we pulled a 90-day sample of access control data from a representative cross-section of the Wellyx customer base, 78 gym brands and 81 branches around the globe. The Wellyx gym access control system logged every member entry across that sample. The dataset:
- 323,875 visits
- 20,311 unique members
- 78 gym brands and 81 branches in the sample
- 90 days of continuous data
This post walks through four findings from that dataset and what they mean for gym owners. Every number is anonymized and aggregated. No individual member, gym, or brand is identifiable.
How a gym access control system captures member behavior
A gym access control system is the software and hardware that controls who enters a fitness facility, when, and through which door. The same setup runs across all kinds of fitness facilities, small boutique studios, big-box clubs, and unstaffed 24/7 sites alike.
Every time a member uses an entry system, a membership card, a key fob system, a QR code from a mobile app, or a biometric reader, the gym check-in system writes a timestamped record to a cloud-based system. Different types of gym (boutique studios, multi-location chains, 24/7 gym access franchises, women’s-only clubs, hotel facilities) feed the same record format back to a single dashboard built for remote management.
That’s the foundation of this analysis. Real swipes. Real timestamps. No estimates.
Ethical considerations
Every gym running on Wellyx uses our gym access control system to manage member entry. The data is owned by the gyms and processed by Wellyx under our Terms of Service. Before publishing, we applied four cleaning steps:
- Member identifiers were one-way hashed using SHA-256. No individual person can be re-identified from this dataset.
- Gym brands and branches were relabeled (Gym 01, Gym 02, etc.). No specific business is named.
- No personal data is published. No names, emails, contact details, or location data appear anywhere in this report.
Note: The patterns and timestamps in this report are exactly what members did. Only the data that could identify them was removed.
Finding 1: January retention is much higher than the industry assumes
Walk into any gym on January 2, and you’ll hear the same joke from the regulars: “It’ll be empty again by February.”
The data says otherwise.
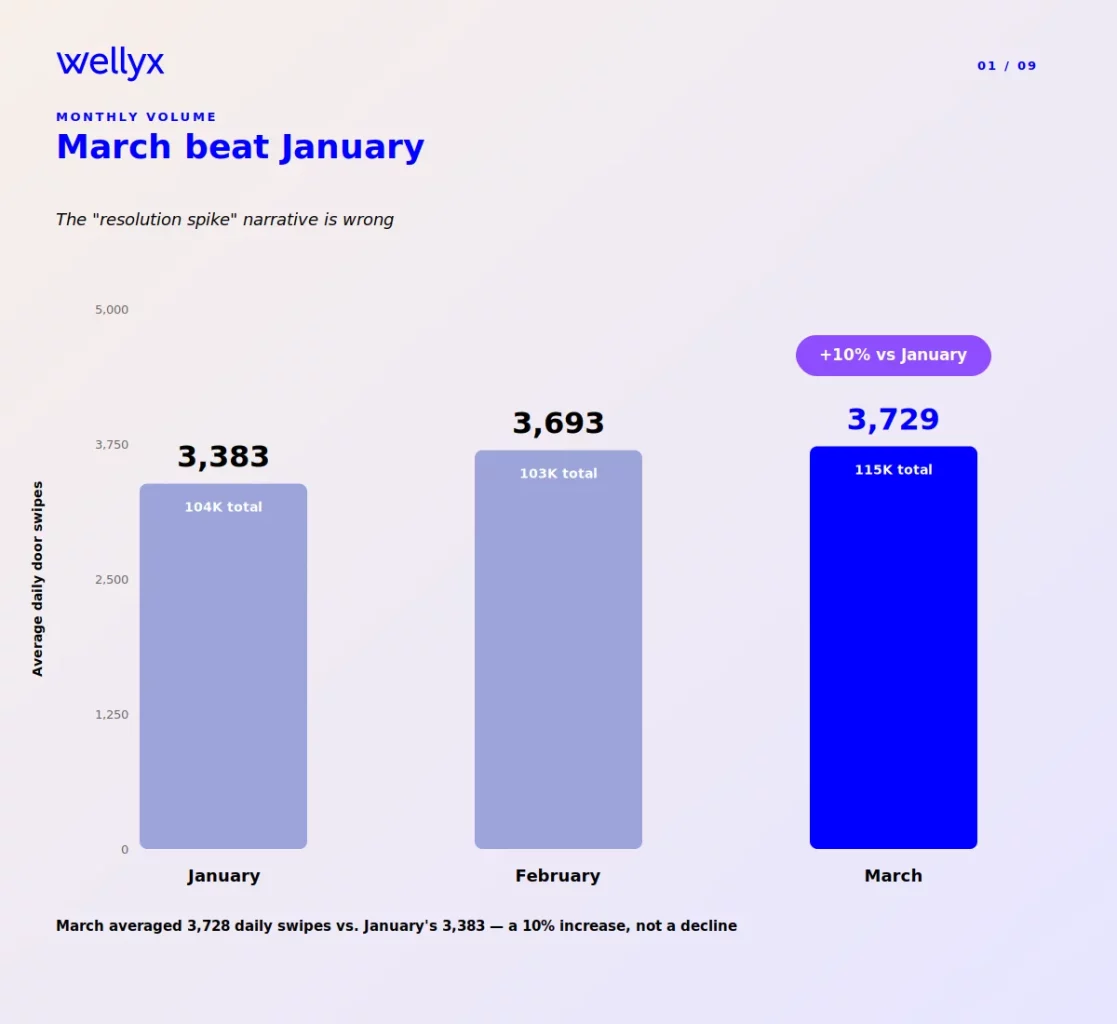
Across the 78-gym sample, January wasn’t the busiest month. March was.
| Month | Total visits | Daily average |
| January | 104,885 | 3,383 |
| February | 103,404 | 3,693 |
| March | 115,586 | 3,728 |
That’s a 10% increase in average daily visits from January to March, not a decline.
Week by week
The monthly view smooths over the within-month variation. The weekly view shows there’s no point in the 90 days where volume collapsed.
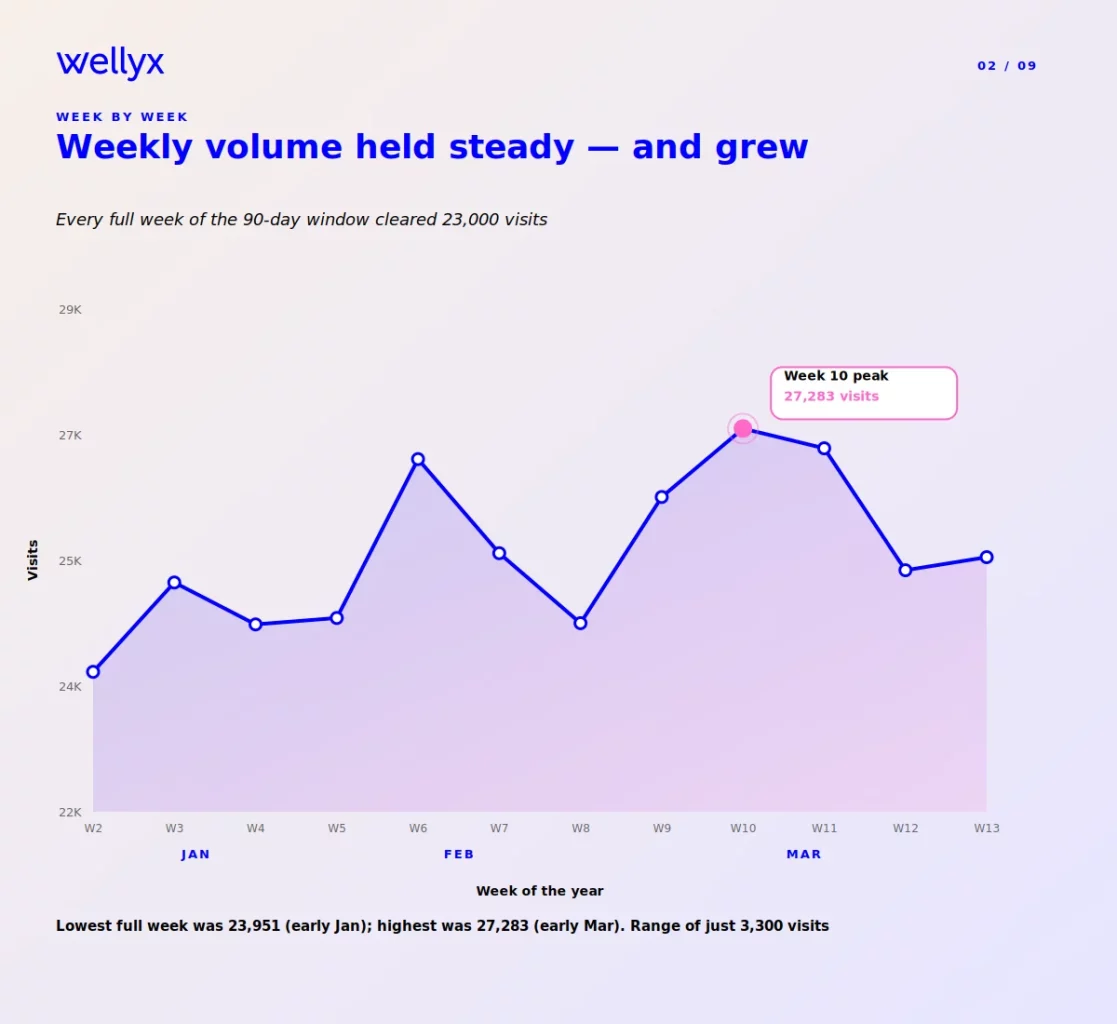
Every full week in the sample cleared 23,000 visits. The lowest full week (week 2, early January) recorded 23,951 visits. The highest (week 10, early March) recorded 27,283, a peak that came two months after the supposed January high. Week-to-week swings stayed inside a narrow band of about 3,300 visits.
If the “everyone quits in February” pattern were real, you’d expect a steep mid-February trough. The data shows the opposite. Week 6 (mid-February) was the third-busiest full week of the entire sample at 26,865 visits.
The cohort that started in January
To test the resolutioners question directly, we built a cohort: every member whose first recorded visit fell between January 1 and January 14 (the classic resolution window). The cohort contained 10,531 members.
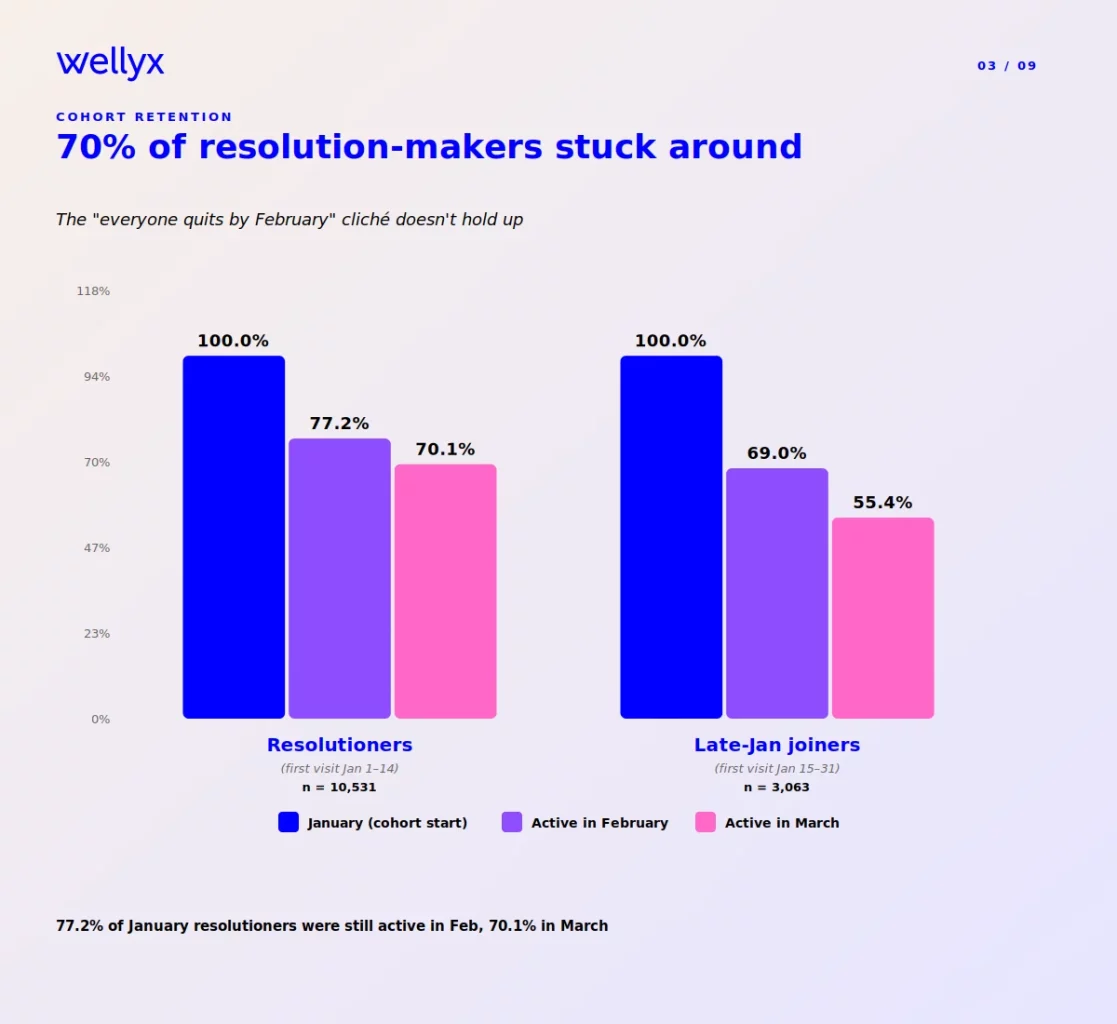
Cohort outcomes:
- 77.2% (8,134 members) were still active in February
- 70.1% (7,384 members) were still active in March
Seven out of ten January joiners were still walking through the door three months later. The cohort that survived the January window also became more committed, not less: visits per active member averaged 9.00 in January, 8.92 in February, and 9.67 in March.
What this means
If you assume January joiners are gone by Valentine’s Day, you’re acting on a false premise. Most are still there. A check-in, a personal trainer offer, or a free class invitation in late January or early February reaches an audience that’s far more engaged than the cliché suggests.
This requires member-level visit tracking. Without it, a January quitter and a January loyalist look identical on a membership report. They’re radically different on a churn report. The all-in-one gym management software with a built-in CRM is what makes that distinction visible.
Finding 2: 30% of weekly visits happen in three hours
Every gym owner knows evenings are busy. The data shows just how concentrated that demand actually is.
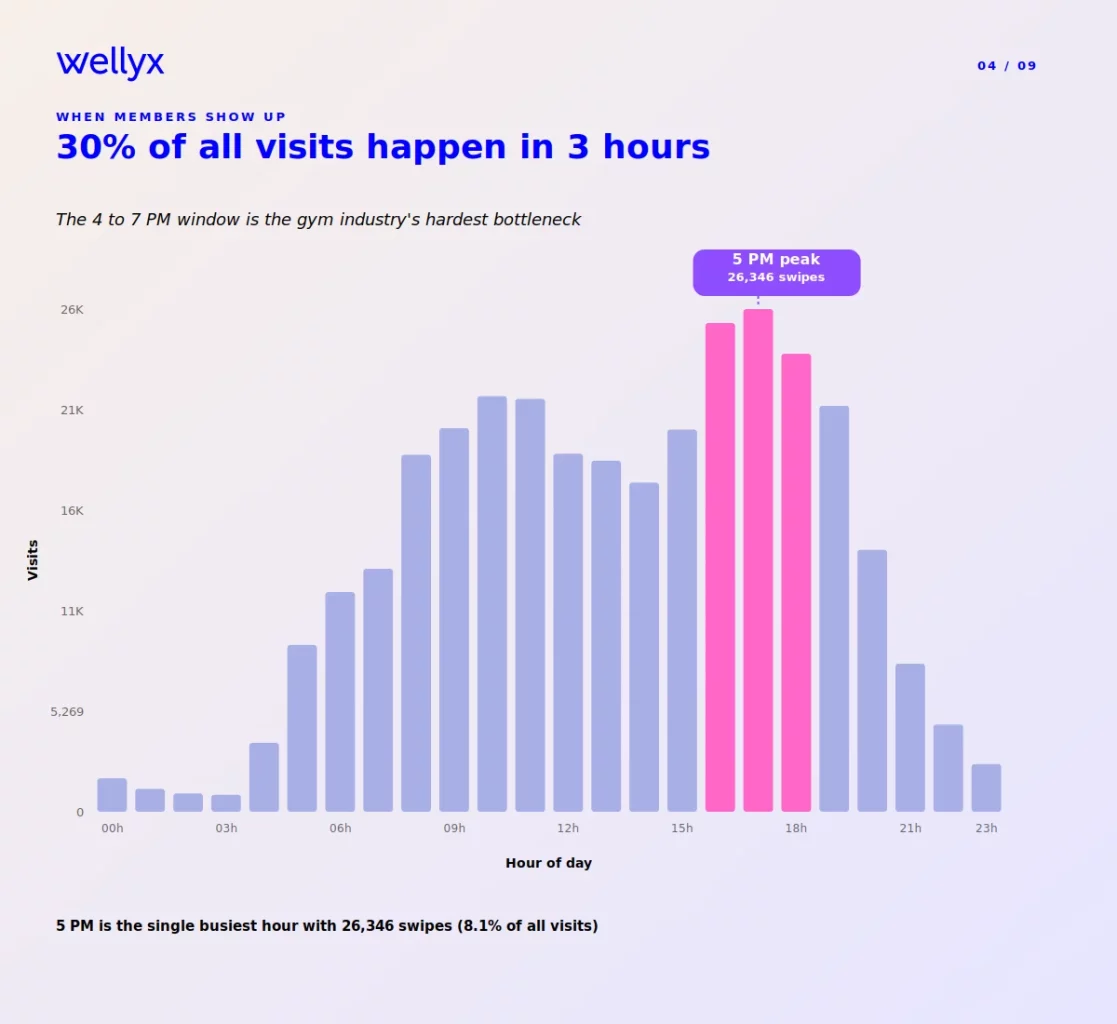
The single busiest hour of the day is 5 PM, with 26,346 swipes, 8.1% of all visits. The bottleneck spans three hours:
| Hour | Visits | % of total |
| 4 PM | 25,614 | 7.9% |
| 5 PM | 26,346 | 8.1% |
| 6 PM | 24,002 | 7.4% |
Together, the 4-to-7 PM window accounts for 30% of all weekly traffic.
For comparison:
- Morning peak (6–9 AM): 19.5% of visits
- Lunch (11 AM–1 PM): 18.2%
- Late nights (after 10 PM): under 3%
Mornings are about two-thirds the volume of evenings, with demand spread more evenly across the morning hours.
Note: The late-night and pre-dawn slivers are small but real. For gyms offering 24/7 gym access, this is the usage pattern that automated access is built to serve, members entering during unstaffed hours, authenticated by the entry system without front-desk involvement.
Day of week
Monday and Tuesday account for 34.8% of weekly visits combined. Sunday accounts for 9.0%. Monday alone generates roughly twice the traffic of Sunday.
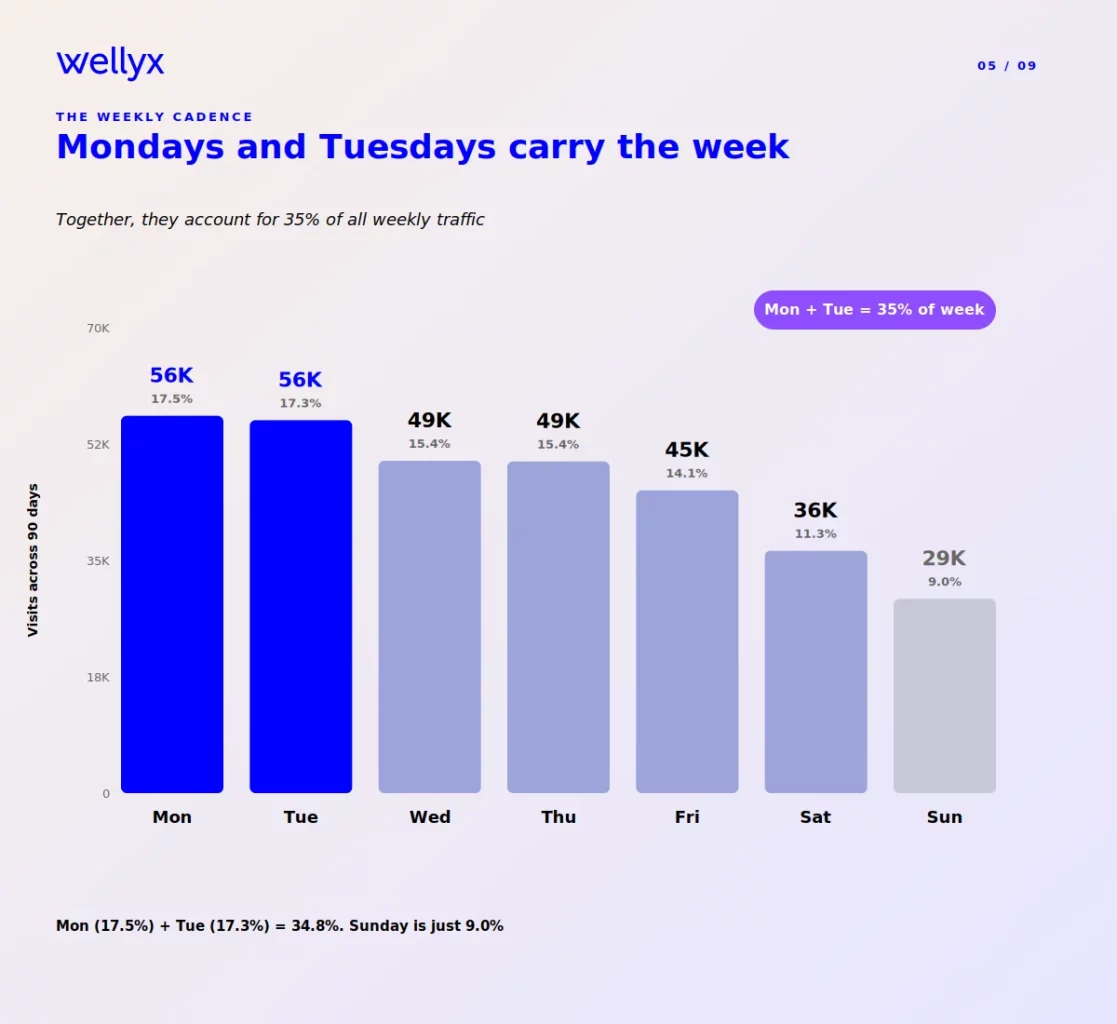
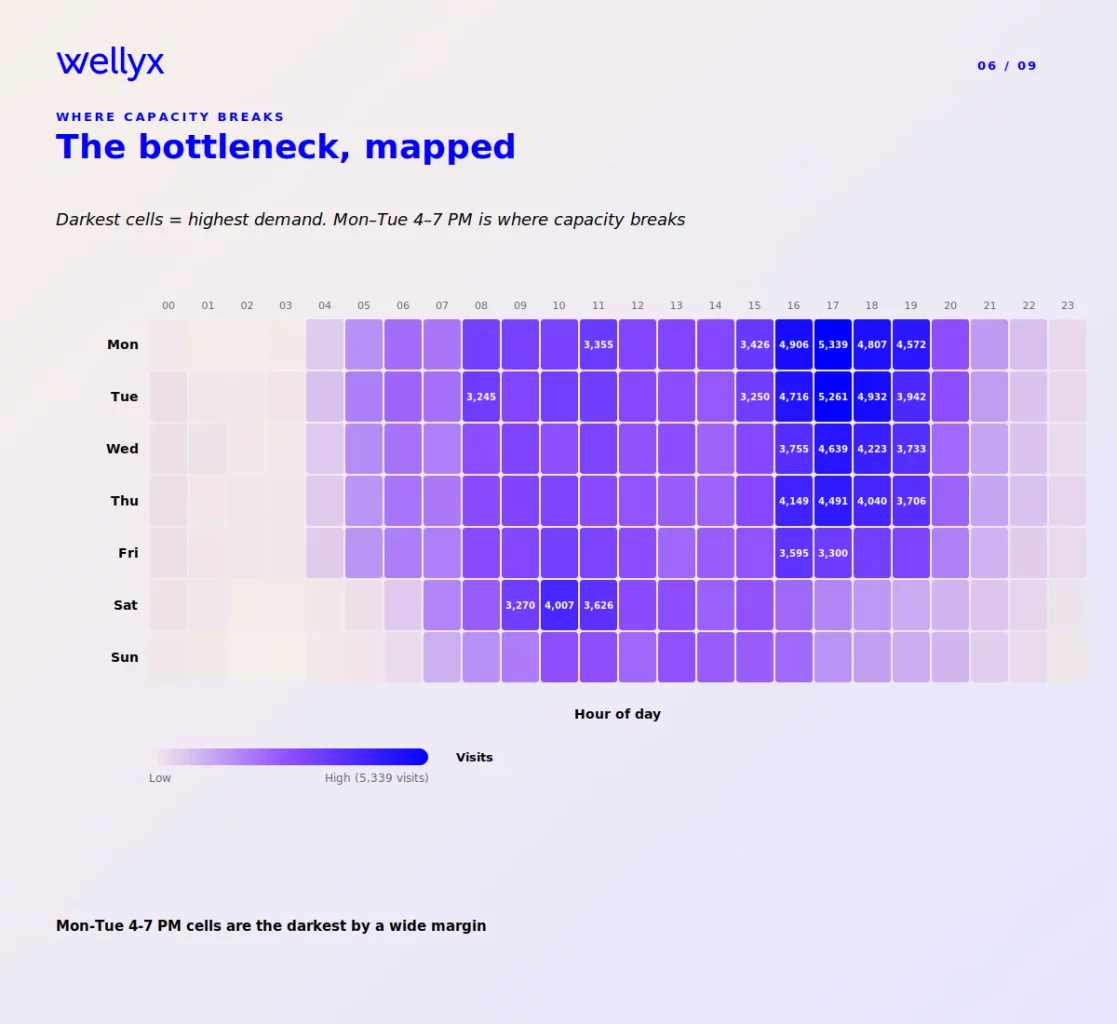
The hour × day heatmap concentrates demand into one block: Monday and Tuesday between 4 and 7 PM. That’s the bottleneck.
What this means
The 4-to-7 PM window has direct operational implications:
- Staffing schedules built around an even daily spread are misaligned with reality.
- Equipment maintenance scheduled for Monday afternoons happens at the worst possible time.
- Group class capacity that doesn’t increase between 4 and 7 PM weekdays leaves your most engaged members frustrated.
A modern gym management software with rule-based access controls lets you address this with data instead of guesswork. You can run targeted off-peak promotions, set service-tier rules to smooth demand, and assign trainers to the windows that need them.
Finding 3: 15% of members generate 50% of visits
Here’s a question every gym operator should be able to answer, but most can’t: what percentage of your visits come from your top members?
Without member-level access data, the answer is a guess. With it, the answer is precise, and it’s brutal.
For the 20,311 members in the dataset:
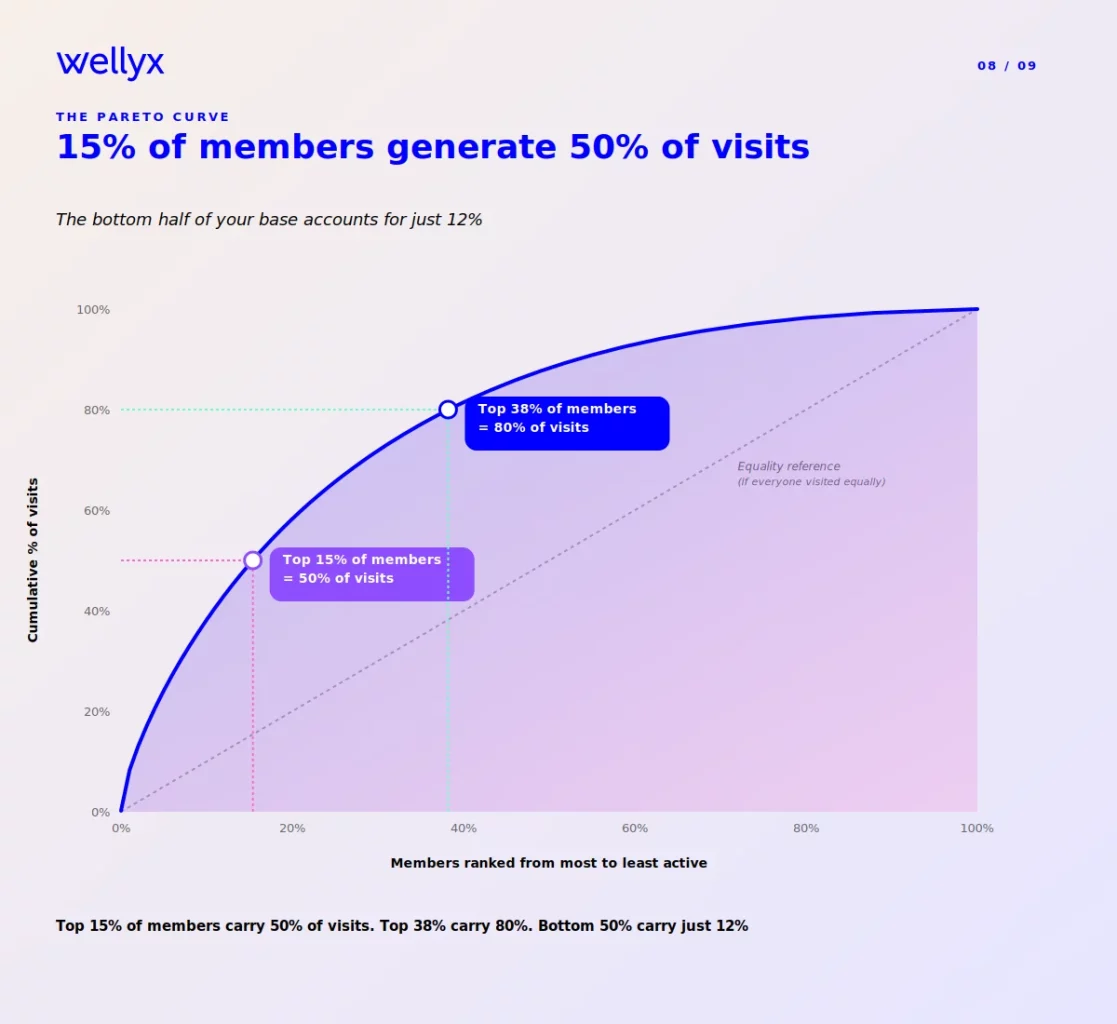
- Top 15% of members generate 50% of all visits
- Top 38% of members generate 80% of all visits
- Bottom 50% of members generate 12% of all visits
If everyone visited equally, the curve would be a diagonal line. Instead, it’s a sharp Pareto distribution.
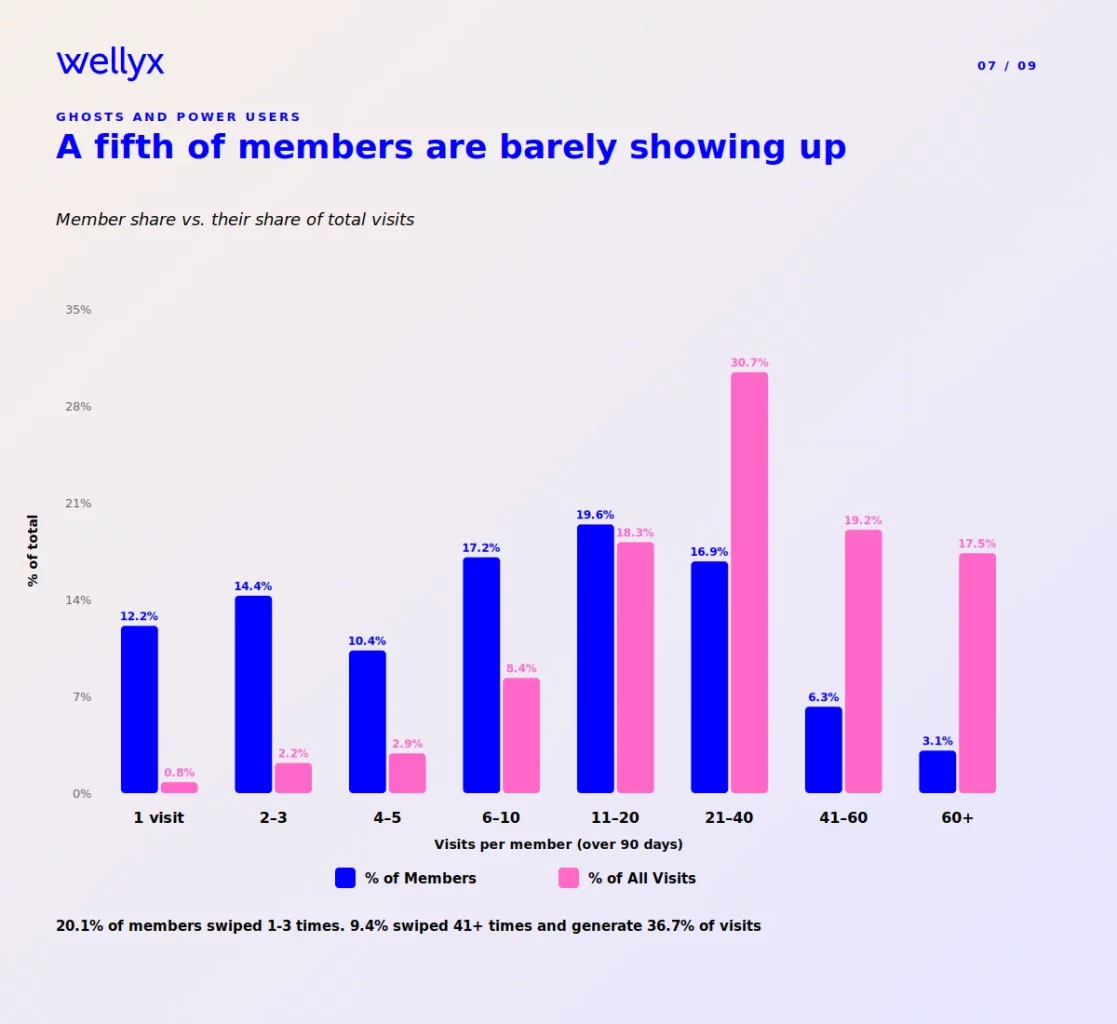
Broken into visit-frequency buckets:
| Visits in 90 days | % of members | % of all visits |
| 1 visit (one-and-done) | 12.2% | 0.8% |
| 2–3 visits | 14.4% | 2.2% |
| 41+ visits (5+ per week) | 9.4% | 36.7% |
20.1% of members swiped in three times or fewer over the entire 90 days. 9.4% of members generated more than a third of all visits.
What this means
A fifth of your membership base is at high churn risk right now. Members who swipe in once or twice over three months almost certainly aren’t getting value from the membership and tend to cancel at the next billing cycle. Most gyms only learn this when the cancellation email arrives.
A gym management software that tracks visit frequency at the member level can flag low-engagement members in week three rather than month three. A re-engagement message, a complimentary personal trainer session, a beginner-friendly class invitation, or a check-in, converts at meaningfully higher rates than a generic email blast.
Retention isn’t really about marketing. It’s about visibility. You can’t retain members you can’t see disengaging.
Finding 4: Men and women train at different times of day
This one surprised us.
We had assumed that gym attendance patterns by gender would look broadly similar, peak in the morning, peak in the evening, roughly synchronized. The data tells a different story.
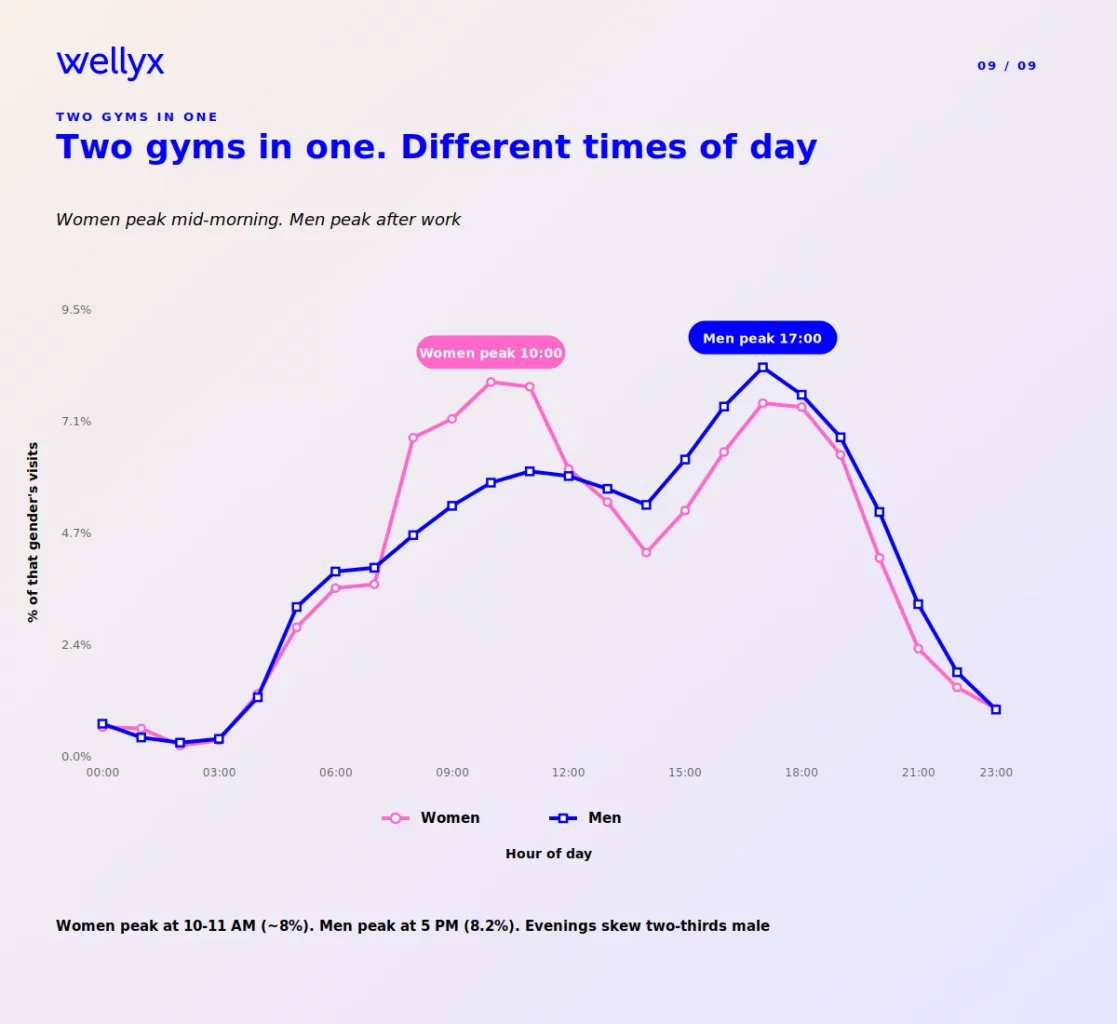
Patterns from the dataset:
- Women’s visits peak at 10–11 AM, accounting for nearly 8% of female visits in each hour
- Men’s visits peak at 5 PM (8.2% of male visits)
- In the 8–11 AM window, women make up 45–47% of visitors, close to parity
- In the 4–7 PM peak, women make up only 35–36% of visitors
The morning crowd is much closer to gender-balanced than the evening crowd. By the after-work rush, the floor is roughly two-thirds male.
Note: Patterns at the brand or branch level may vary significantly from this aggregate view (a women’s-only studio would show a different curve). These are correlations, not explanations, the data shows when people train, not why.
What this means
Morning and evening programming should look different, because the audience is different. A 7 AM HIIT class and a 6 PM HIIT class don’t serve the same demographic. Treating them as interchangeable misses an engagement opportunity.
This kind of insight comes from connecting access control data to the rest of your operations. The data is already in your gym access control system. The question is whether your software surfaces it.
What this means for gym owners
Four findings, one direction. Most patterns in your gym are invisible without proper instrumentation.
- January retention is much higher than the industry assumes. Seven out of ten January joiners are still active in March.
- The 4-to-7 PM block is doing 30% of your weekly volume. That’s a structural bottleneck, not a peak.
- Half your visits come from 15% of your base. A fifth of your members are barely showing up.
- Morning and evening crowds aren’t the same demographic. Your programming should reflect that.
Every one of these patterns is visible inside a properly instrumented gym software, one that captures the door, the calendar, payments, the member profile, and engagement history in one place.
The Wellyx gym management software brings access control, member engagement, billing, scheduling, and retention reporting into one user-friendly cloud-based system. Whether you run a boutique studio with set open hours or a 24/7 gym access franchise, the platform supports every type of credential members prefer, membership card, key fob system, QR code from a mobile app, or biometric, and lets you remotely manage every door from one dashboard. Reports can be filtered, exported, and easily shared across your team.
If you’re running your gym on disconnected tools, an entry system here, a billing platform there, a separate CRM, a third-party class booking app, you’re looking at the same member behavior we are. You just can’t see it.
Frequently asked questions
What is a gym access control system?
A gym access control system is the software and hardware that manages who can enter a fitness facility, when, and through which door. Modern systems pair an entry reader (key fob, membership card, QR code on a mobile app, or biometric) with a cloud-based system that authenticates the credential against the member’s billing status and access permissions in real time. Every entry is logged.
How is gym access control different from gym management software?
Access control is one component of a complete gym management software platform. Standalone access control handles the door. A full gym management software handles billing, member CRM, class scheduling, point-of-sale, staff management, and reporting alongside access, so the data from the door connects to everything else.
Can a gym access control system support 24/7 gym access?
Yes. Automated access is one of the main reasons unstaffed and 24/7 gym access models work financially. The system authenticates members at the door without staff present, enforces membership status in real time, and sends an alert if anything looks irregular. Our dataset includes a real but small volume of pre-dawn and late-night visits from gyms operating this way.
What types of credentials does a modern gym check-in system support?
Most modern systems support several at once:
- Physical membership card
- Key fob system
- QR code displayed in a mobile app
- Biometric (fingerprint or facial recognition)
Members typically pick whichever they prefer. Reports stay consistent regardless of credential type.
How do gym owners get value from access control data beyond entry management?
Three main ways:
- Capacity and staffing. Knowing your real peak hours by day of week.
- Retention. Flagging members whose visit frequency drops before they cancel.
- Programming. Designing class schedules, offers, and trainer availability around when members actually show up rather than when you assume they do.
Every finding in this report came from one of those three categories.
This report is compiled from anonymized, aggregated access control data sampled from the global Wellyx customer base. The sample covers 323,875 visits from 20,311 unique members across 78 gym brands and 81 branches over a 90-day window. Member-level data is irreversibly hashed. No individual member, gym, or branch is identifiable in any published output. Data collection is authorized under the Wellyx Terms of Service.
Want to see what your gym’s data is telling you? Book a free Wellyx demo and walk through how gym access control, member engagement, and retention reporting work together in one platform.